

Image Details
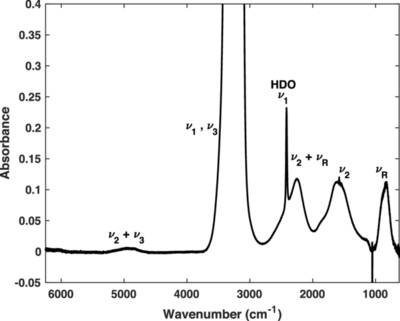
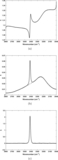
Caption: Figure 4.
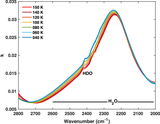
The absorbance spectrum of a 2% HDO and 98% H2O sample at 80 K. The HDO ν1 (O–D stretch) band is clearly visible at 2416 cm−1 (4.14 μm). The remaining features are H2O bands labeled with their vibrational modes, except for the feature at 1052 cm−1, which is an artifact in the data. The H2O feature near 3333 cm−1 (3 μm) is saturated, so we cannot compute optical constants for this band.
Other Images in This Article
Show More
Copyright and Terms & Conditions
© 2026. The Author(s). Published by the American Astronomical Society.

Copyright ©
2026 Astronomy Image Explorer. All Rights Reserved.
