

Image Details
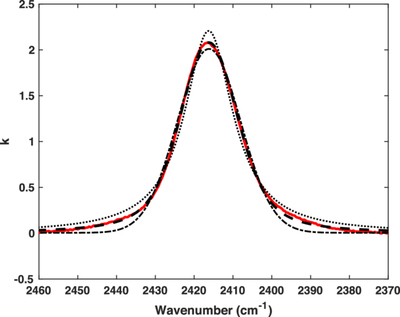
Caption: Figure 7.
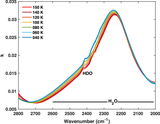
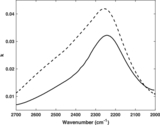
Comparison of the best-fitting Gaussian (dashed–dotted line), Lorentzian (dotted line), and Voigt (dashed line) band profiles to the HDO band measured at 80 K (red line). The Voigt profile provides a closer match to the HDO band than the Gaussian or Lorentzian profile, thereby enabling us to provide analytical expressions for HDO effective optical constants using Equations (3)–(7) and Table 1.
Other Images in This Article
Show More
Copyright and Terms & Conditions
© 2026. The Author(s). Published by the American Astronomical Society.

Copyright ©
2026 Astronomy Image Explorer. All Rights Reserved.
