

Image Details
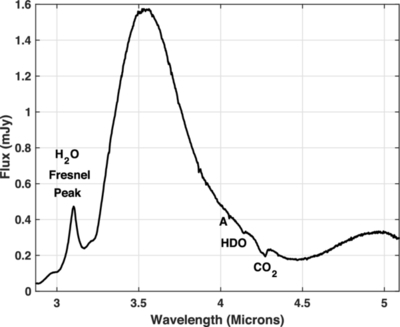
Caption: Figure 1.
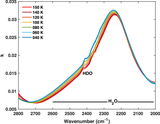
Spectrum of Titania’s leading hemisphere taken with JWST and NIRSpec (R. J. Cartwright 2026). Peak absorptions of the weak HDO and CO2 bands are observed at 4.14 and 4.27 μm, respectively. An artifact (A) of the data reduction process appears at 4.05 μm. The HDO band is distinct from the artifact and CO2 band. The feature at 3.1 μm is the H2O Fresnel peak.
Other Images in This Article
Show More
Copyright and Terms & Conditions
© 2026. The Author(s). Published by the American Astronomical Society.

Copyright ©
2026 Astronomy Image Explorer. All Rights Reserved.
