

Image Details
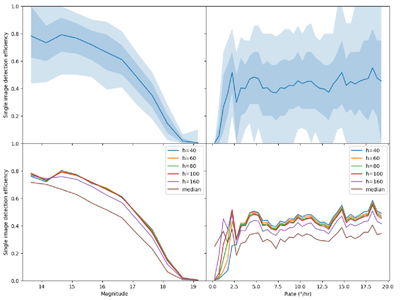
Caption: Figure 4.
Single image detection efficiency as a function of magnitude (left) and rate of motion (right), for bins of 0.5 mag or 0﹩\mathop{.}\limits^{{\unicode{x02033}}}﹩5 hr−1. Top panels: the detection efficiency of detecting implanted synthetic objects in images cleaned using a donut template with h = 100, d = 40; the efficiency averaged over all images is shown by the dark blue line, while the medium and light blue regions show the range that 68% and 95% of the 1108 images fall within, respectively. Bottom panels: average curves analogous to the dark line in the top panels but with different h values for the donut templates; also shown (brown line) is the detection efficiency if a “median of all images” template is used. Note that the detection efficiency as a function of rate includes objects of all magnitudes; the y-axis is thus somewhat arbitrary and scales according to the magnitude distribution of the implanted synthetic sources.
Other Images in This Article
Copyright and Terms & Conditions
© 2026. The Author(s). Published by the American Astronomical Society.

