

Image Details
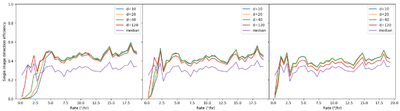
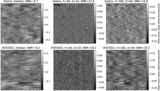
Caption: Figure 5.
Single image detection efficiency as a function of rate, using h = 40 (left), h = 100 (middle), and h = 160 (right) and a range of d values, as well as using a median template of all 1108 images. These curves are analogous with the solid line in the right panel of Figure 4, but comparing the results for different parameters.
Other Images in This Article
Copyright and Terms & Conditions
© 2026. The Author(s). Published by the American Astronomical Society.

Copyright ©
2026 Astronomy Image Explorer. All Rights Reserved.
