

Image Details
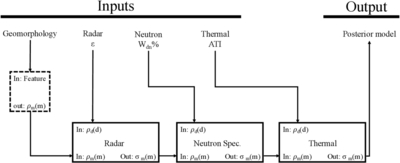
Caption: Figure 3.
Bayesian inversion flowchart for interpreting ice in the shallow subsurface (<5 m). Each solid outlined box represents an implementation of the Bayesian inversion process depicted in Figure 2. The dashed box represents our prior knowledge from geomorphology.
Other Images in This Article


Show More
Copyright and Terms & Conditions
© 2026. The Author(s). Published by the American Astronomical Society.

Copyright ©
2026 Astronomy Image Explorer. All Rights Reserved.
