

Image Details
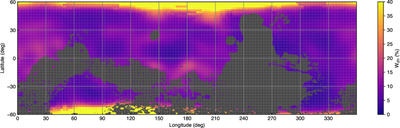
Caption: Figure 7.
Hydrogen abundance data from MONS within the latitudinal bounds of the SWIM study area, expressed as lower-layer WEH content (W﹩{}_{{dn}}﹩) (A. V. Pathare et al. 2018). Dark gray regions are above the 1 km elevation cutoff.
Other Images in This Article




Show More
Copyright and Terms & Conditions
© 2026. The Author(s). Published by the American Astronomical Society.

Copyright ©
2026 Astronomy Image Explorer. All Rights Reserved.
