

Image Details
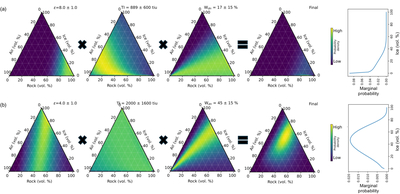
Caption: Figure 16.
Two demonstrations of the Bayesian inversion method: (a) Measurements that constrain the subsurface dielectric permittivity to 8.0 ± 3.5, the thermal inertia to 889 ± 600 tiu, and the W﹩{}_{{dn}}﹩ to 17% ± 15% yield a low probability of ice in the subsurface, with maximum probability density at 0% ice. (b) Measurements that constrain the subsurface dielectric permittivity to 4.0 ± 1.0, the thermal inertia to 2000 ± 1600 tiu, and the W﹩{}_{{dn}}﹩ to 45% ± 15% yield a high probability of ice in the subsurface, with maximum probability density at 40% ice. The final posterior probability plot is the joint probability between each dataset. We create the marginal PDF for subsurface ice (the rightmost plots, rotated so the ice% axis aligns with the ternary plots) by integrating over the rock axis in the full ternary posterior distribution.
Other Images in This Article




Show More
Copyright and Terms & Conditions
© 2026. The Author(s). Published by the American Astronomical Society.

