

Image Details
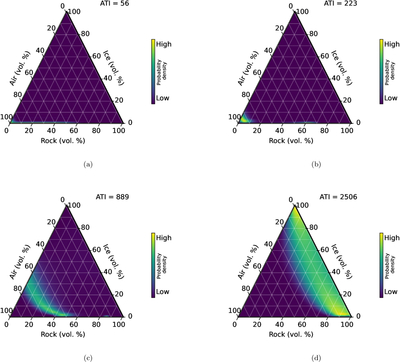
Caption: Figure 11.
These panels represent PDFs of the ice content models that can satisfy four values of apparent thermal inertia in the subsurface from thermal imaging: (a) ATI = 56 tiu, (b) ATI = 223 tiu, (c) ATI = 889 tiu, and (d) ATI = 2506 tiu, which are the model values of dust, sand, duricrust, and rock (N. E. Putzig & M. T. Mellon 2007). In the model that we use, any amount of pore-filling ice greatly increases the ATI. So low ATI measurements restrict models to the air-rock axis. These plots include no measurement uncertainty; the spreads in the distributions come from uncertainty in rock properties as we describe in the text.
Other Images in This Article




Show More
Copyright and Terms & Conditions
© 2026. The Author(s). Published by the American Astronomical Society.

