

Image Details
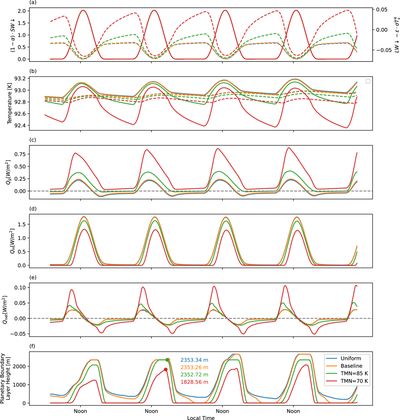
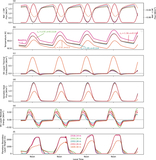
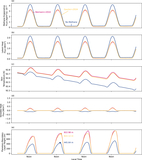
Caption: Figure A5.
Multi-Tsol (simulated Tsols 2–5) evolution of (a) net downward shortwave flux (solid lines) and net downward infrared flux (dashed lines), (b), surface skin temperature (solid lines) and air temperature in the lowest atmospheric layer (dashed lines), (c) thermal conduction in the shallowest subsurface layer, (d) surface sensible heat flux, (e) net residual energy in the shallowest subsurface layer, and (f) PBL depth for dry simulations with varied deep subsurface fixed temperatures. The maximum PBL depth on Tsol 3 is listed in the main text.
Other Images in This Article
Show More
Copyright and Terms & Conditions
© 2026. The Author(s). Published by the American Astronomical Society.

Copyright ©
2026 Astronomy Image Explorer. All Rights Reserved.
