

Image Details
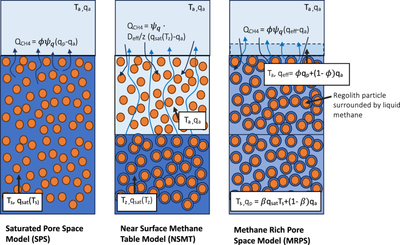
Caption: Figure 2.
Cartoon depiction of the subsurface methane distribution in the three parameterizations developed for the study: the SPS model (left), the NSMT model (middle), and the MRPS model (right). Orange circles represent regolith particles, dark-blue colors indicate liquid methane, and light-blue colors in the subsurface (as in the MRPS diagram) indicate a mixture of methane vapor and air. The lightest blue shows the methane abundance in the lowest atmospheric layer. An additional prescribed atmospheric layer is parameterized in the MRPS scheme with an intermediate methane abundance between the pore space and atmospheric methane mixing ratios. This layer is indicated by the dashed line in panel (c).
Other Images in This Article
Show More
Copyright and Terms & Conditions
© 2026. The Author(s). Published by the American Astronomical Society.

