

Image Details
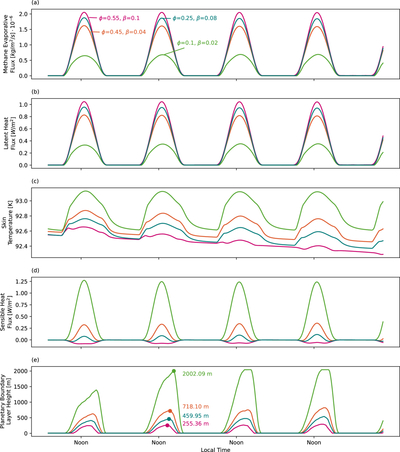
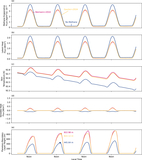
Caption: Figure 13.
Same as Figure 10, but for the MRPS results. (a) Methane evaporation rate [kg m−2 s−1] scaled by ﹩1\times {10}^{-6}﹩; (b) latent heat flux [W m−2]; (c) skin temperature [K]; (d) sensible heat flux [W m−2]; (e) PBL depth [m]. The maximum depth on the PBL on Tsol 3 is listed in the main text. Individual simulations are labeled in panel (a) and include simulations with prescribed porosity, methane pore space abundance pairs (pink line: ﹩\phi ﹩ = 0.55, ﹩\beta ﹩ = 0.1; green line: ﹩\phi ﹩ = 0.1, ﹩\beta ﹩ = 0.02; blue line: ﹩\phi ﹩ = 0.25, ﹩\beta ﹩ = 0.08; orange line: ﹩\phi ﹩ = 0.45, ﹩\beta ﹩ = 0.04).
Other Images in This Article
Show More
Copyright and Terms & Conditions
© 2026. The Author(s). Published by the American Astronomical Society.

