

Image Details
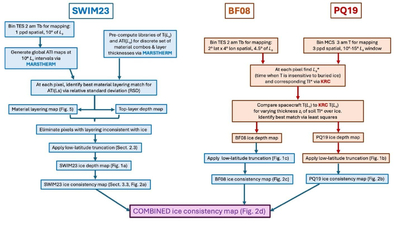
Caption: Figure 3.
Flowchart summarizing the methodology of the SWIM23, BF08, and PQ19 maps (Figure 1)—see Table 1 for a more detailed discussion. Blue indicates steps in the analysis undertaken as part of N. E. Putzig et al. (2023) and this study, while tan indicates steps in the analysis done by J. L. Bandfield & W. C. Feldman (2008) and S. Piqueux et al. (2019).
Other Images in This Article
Show More
Copyright and Terms & Conditions
© 2026. The Author(s). Published by the American Astronomical Society.

Copyright ©
2026 Astronomy Image Explorer. All Rights Reserved.
