

Image Details
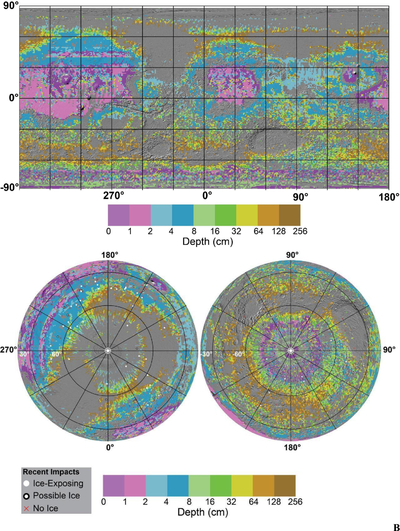
Caption: Figure 5.
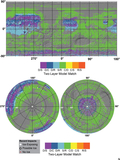
The SWIM23 two-layer heterogeneity match (a) and depth (b) maps prior to rejection of low-latitude detections. Both maps are shown in simple cylindrical and polar projections. Both maps were produced by matching model ATI(Ls) calculated via MARSTHERM to ATI(Ls) derived from TES nighttime bolometric temperatures (N. E. Putzig & M. T. Mellon 2007; N. E. Putzig et al. 2023). Model selection was based on a maximum RSD of RSD = 40, and depths were calculated via a linear RSD interpolation between thermal model depth nodes. Only layering scenarios interpreted as potentially icy are shown in (a), where D = dust, S = sand, C = duricrust, R = rock/ice. Locations of recent impacts (C. M. Dundas et al. 2021) are indicated by white circles (icy), white circles with black borders (possible ice), and red X’s (no indication of ice).
Other Images in This Article
Show More
Copyright and Terms & Conditions
© 2026. The Author(s). Published by the American Astronomical Society.

