

Image Details
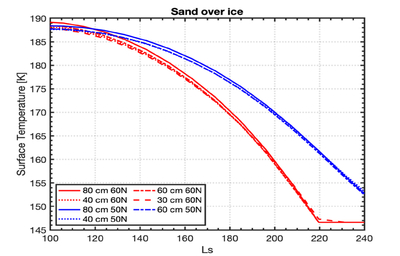
Caption: Figure 13.
Seasonal temperature curves produced via MARSTHERM for 50°N (blue) and 60°N (red), illustrating close similarity between the surface thermal behavior for ice at depths >30 cm.
Other Images in This Article
Show More
Copyright and Terms & Conditions
© 2026. The Author(s). Published by the American Astronomical Society.

Copyright ©
2026 Astronomy Image Explorer. All Rights Reserved.
