

Image Details
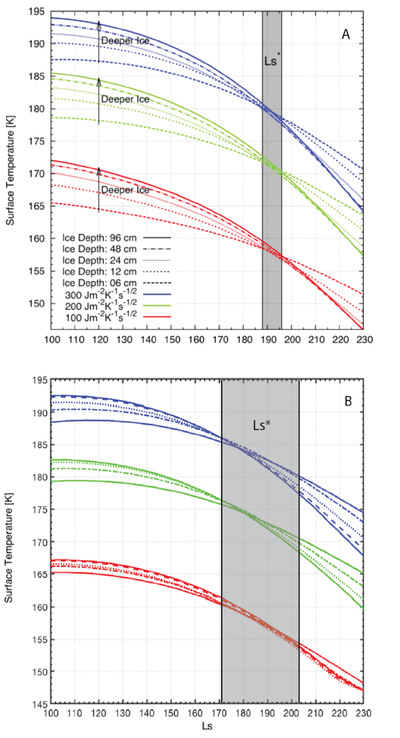
Caption: Figure 12.
Seasonal temperature curves at 45°N latitude as predicted by (a) S. Piqueux et al. (2019) using KRC and (b) SWIM23 using MARSTHERM. The gray zone corresponds to the period of time in the Martian orbit (Ls*) when surface temperature is insensitive to the distribution of buried ice. Note that MARSTHERM predicts less temperature separation with respect to ice table depth and a wider range of Ls* with varying surface TI than KRC.
Other Images in This Article
Show More
Copyright and Terms & Conditions
© 2026. The Author(s). Published by the American Astronomical Society.

Copyright ©
2026 Astronomy Image Explorer. All Rights Reserved.
