Image Details
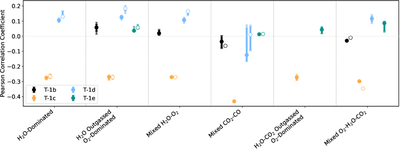
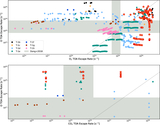
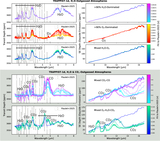
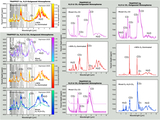
Caption: Figure 14.
The 1σ (darker colored bars) and 2σ (lighter colored bars) ranges of PCCs when comparing all atmospheres of a given archetype for a given planet to the available JWST transmission data for that planet (T-1 b, c, d and e). The bars with filled and unfilled circular points denote atmospheres without and with the addition of trace SO2, respectively. The dotted horizontal gray line shows where PCC = 0; points that fall above that line indicate a positive correlation and points that fall below indicate a negative correlation to the transmission data.
Other Images in This Article
Show More
Copyright and Terms & Conditions
© 2026. The Author(s). Published by the American Astronomical Society.
Copyright ©
2026 Astronomy Image Explorer. All Rights Reserved.