Image Details
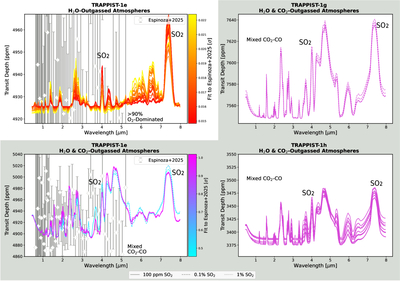
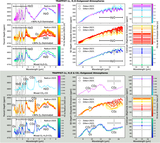
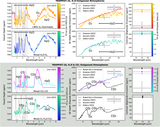
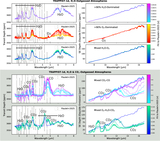
Caption: Figure 13.
Similar to Figure 6, but for the SO2-bearing atmospheres of T-1 e, g, and h. T-1 f had no stable atmospheres containing SO2 so it is not included here. The top and bottom left subplots show H2O outgassed, O2-dominated, and mixed CO2–CO atmospheres for T-1 e that contain trace SO2; and the top and bottom right subplots show mixed CO2–CO atmospheres with trace SO2 for T-1 g and h. Solid, dashed, and dotted lines indicate that 100 ppm, 0.1%, or 1% SO2, respectively, was added to the bottom layer of the atmosphere.
Other Images in This Article
Show More
Copyright and Terms & Conditions
© 2026. The Author(s). Published by the American Astronomical Society.
Copyright ©
2026 Astronomy Image Explorer. All Rights Reserved.