Image Details
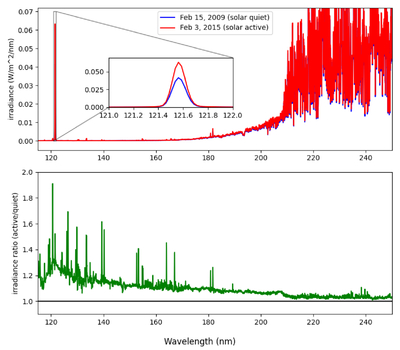
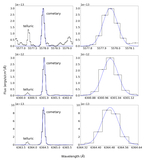
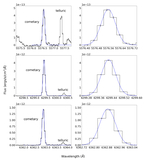
Caption: Figure 7.
Top panel: total solar spectral irradiance for two dates plotted as a function of wavelength. The two dates plotted correspond to two of our observation dates, one each for Lovejoy and Lulin. The bottom panel plots the ratio between the two spectra (green), with the straight black line showing a ratio equal to one for easier visual comparison. The solar quiet spectrum is shown to have a consistently lower irradiance, such that the ratio is always greater than one. However, the difference is more pronounced at shorter wavelengths, particularly at the Lyα line, which is shown in a zoomed-in box in the top panel. Data retrieved from the LASP Interactive Solar Irradiance Datacenter (LISIRD) database using the NNL high-resolution model (Laboratory for Atmospheric and Space Physics 2005).
Other Images in This Article
Copyright and Terms & Conditions
© 2026. The Author(s). Published by the American Astronomical Society.