Image Details
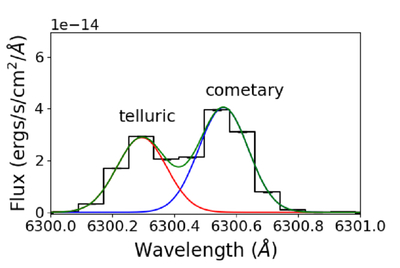
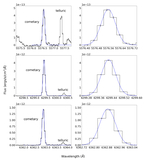
Caption: Figure 2.
Region of the spectrum obtained of Lovejoy on UT 2015 May 11 that contains the forbidden oxygen line at 6300 Å. Note that the cometary line appears redward of 6300 Å due to Doppler shifting caused by the comet’s geocentric velocity. The data are represented by a histogram (black) with 1σ errorbars. Due to the high signal-to-noise, the error bars are quite small, with typical values around 1% of the flux. The data are fitted with two separate Gaussians corresponding to the telluric (red) and cometary (blue) features. The sum of the two Gaussian components is plotted in green.
Other Images in This Article
Copyright and Terms & Conditions
© 2026. The Author(s). Published by the American Astronomical Society.
Copyright ©
2026 Astronomy Image Explorer. All Rights Reserved.