Image Details
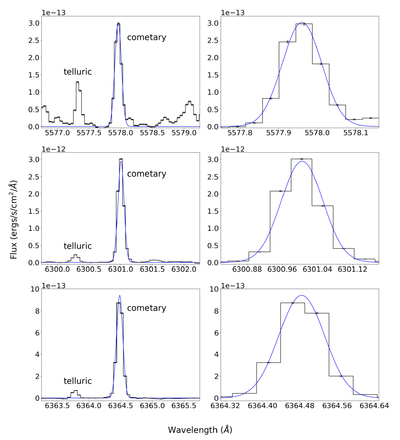
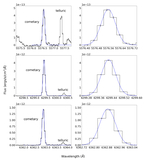
Caption: Figure 4.
Regions of the spectra obtained of Lovejoy on UT 2015 February 3 that contain the forbidden oxygen lines at 5577 Å (top row), 6300 Å (middle row), and 6364 Å (bottom row). Note that the cometary line appears redward of the telluric in all plots due to Doppler shifting caused by the comet’s geocentric velocity. The data are represented by a histogram (black) with 1σ errorbars. The right column shows the cometary lines fitted with Gaussian curves (blue). The left column displays a zoomed-out view such that both the cometary and telluric lines are visible as well as the surrounding signal-to-noise. In the top left panel, the weaker features surrounding the two oxygen lines are due to emission from C2.
Other Images in This Article
Copyright and Terms & Conditions
© 2026. The Author(s). Published by the American Astronomical Society.