Image Details
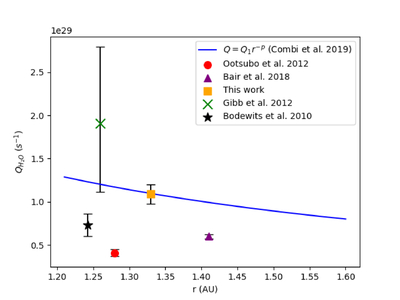
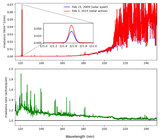
Caption: Figure 6.
Water production rates for Lulin from the literature, with the power-law prediction by M. R. Combi et al. (2019) for the relationship between water production rate and heliocentric distance postperihelion overplotted. Some scatter is present in the data, with three measurements falling under the predictive curve from M. R. Combi et al. (2019). The uncertainty on the production rate from A. N. Bair et al. (2018) represents the standard deviation of their measurements; however, the error bars are smaller than the size of the marker on the graph.
Other Images in This Article
Copyright and Terms & Conditions
© 2026. The Author(s). Published by the American Astronomical Society.
Copyright ©
2026 Astronomy Image Explorer. All Rights Reserved.