Image Details
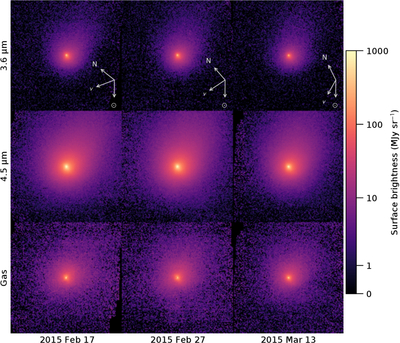
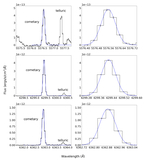
Caption: Figure 3.
Spitzer IRAC images of comet C/2014 Q2 (Lovejoy). Top row: 3.6 μm images. Center row: 4.5 μm images. Bottom row: derived CO2 gas maps. All images are displayed with an asinh color scale intended to show both the low-surface brightness instrumental background and the bright cometary core. Arrows indicate the projected Celestial north (N), Sun (⊙), and velocity (v) vectors. Each subpanel is 8﹩\mathop{.}\limits^{^{\prime} }﹩1 × 8﹩\mathop{.}\limits^{^{\prime} }﹩1.
Other Images in This Article
Copyright and Terms & Conditions
© 2026. The Author(s). Published by the American Astronomical Society.
Copyright ©
2026 Astronomy Image Explorer. All Rights Reserved.