Image Details
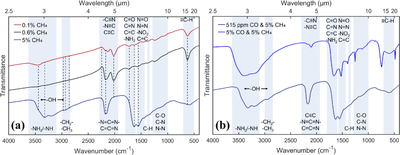
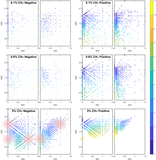
Caption: Figure 3.
(a) FTIR spectra of three tholins from 4000 to 500 cm−1, where the red, black, and blue lines represent the 0.1%, 0.6%, and 5% CH4 tholins, respectively. (b) Comparison of 5% CH4 tholin in this study with Titan tholins in previous work (90% N2/5% CH4/ 5% CO, Z. Yang et al. 2025). The corresponding functional groups are marked near their absorption features.
Other Images in This Article
Copyright and Terms & Conditions
© 2026. The Author(s). Published by the American Astronomical Society.
Copyright ©
2026 Astronomy Image Explorer. All Rights Reserved.