Image Details
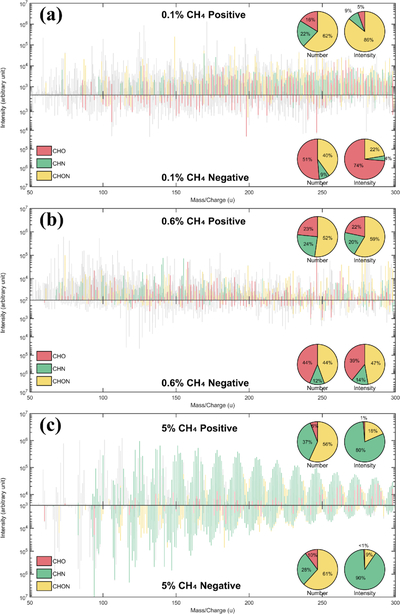
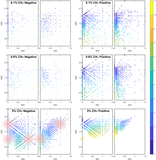
Caption: Figure 4.
Very-high-resolution mass spectra of tholins produced with different CH4 mixing ratios ((a) 0.1%, (b) 0.6%, and (c) 5%) in both positive and negative ion mode. The red, green, and yellow colors correspond to the CHO, CHN, and CHON subgroups, respectively. Additionally, gray represents data that could not match any molecular formula within the allowable mass precision (<0.0001). The two pie charts in the upper right corner of each subplot illustrate (i) the number percentage of molecular formulas within each subgroup, and (ii) the abundance percentage based on the summed peak intensities of matched organic molecules.
Other Images in This Article
Copyright and Terms & Conditions
© 2026. The Author(s). Published by the American Astronomical Society.