Image Details
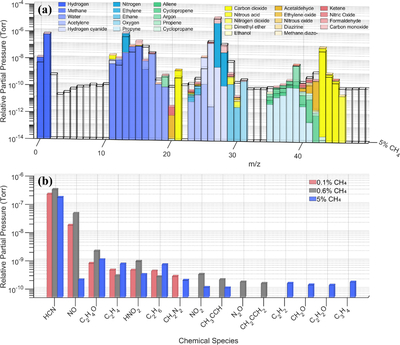
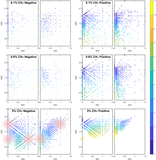
Caption: Figure 1.
(a) The mass spectrum deconvolution results of the 5% CH4 experiment. The black outline represents the normalized RGA data, and the colored segments indicate the contribution of different species to the mass as calculated by the model. The signal intensity of the RGA correlates with the partial pressure of the detected gases. (b) Deconvolution results in the three experiments with different CH4 mixing ratios (0.1%, 0.6%, and 5%). The major products are defined as species with relative partial pressure greater than 1 × 10⁻¹⁰, while species with partial pressure below 1 × 10⁻¹⁰ are considered to be indistinguishable from noise and do not represent the primary pathways or trends for product formation, and thus are not listed here.
Other Images in This Article
Copyright and Terms & Conditions
© 2026. The Author(s). Published by the American Astronomical Society.