Image Details
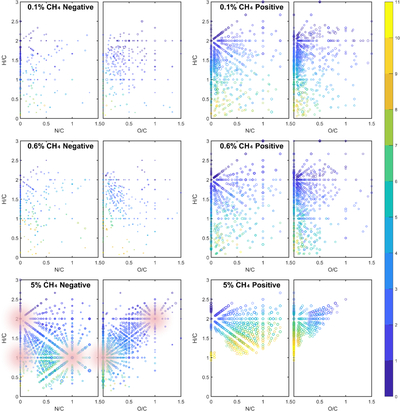
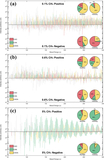
Caption: Figure 5.
Van Krevelen diagrams (H/C versus O/C and H/C versus N/C) of the positive and negative ionization modes at the three experimental conditions. The color code represents the molecules’ DBEs, and the symbol size is proportional to the peak intensity of the VHRMS. The centers of the radiating patterns are indicated by semitransparent red dots in the lower left panels.
Other Images in This Article
Copyright and Terms & Conditions
© 2026. The Author(s). Published by the American Astronomical Society.
Copyright ©
2026 Astronomy Image Explorer. All Rights Reserved.