Image Details
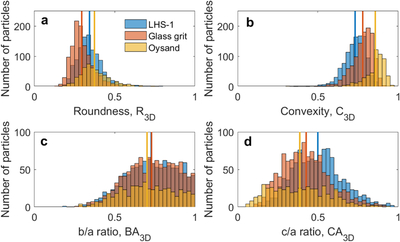
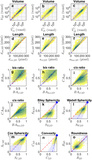
Caption: Figure A1.
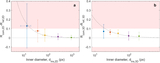
Distribution of the (a) 3D roundness, (b) convexity, (c) the b/a ratio, and (d) the c/a ratio for the particles analyzed: LHS-1 (blue), glass grit (red), and Øysand grains (yellow). Solid lines represent the average of each distribution for the respective samples.
Other Images in This Article
Show More
Copyright and Terms & Conditions
© 2026. The Author(s). Published by the American Astronomical Society.
Copyright ©
2026 Astronomy Image Explorer. All Rights Reserved.