Image Details
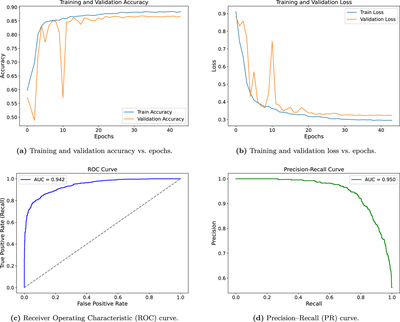
Caption: Figure 3.
Evaluation metrics for the GRU model. Panels (a) and (b) show the evolution of accuracy and loss during training, while panels (c) and (d) depict the ROC and PR curves, respectively.
Other Images in This Article
Copyright and Terms & Conditions
© 2026. The Author(s). Published by the American Astronomical Society.
Copyright ©
2026 Astronomy Image Explorer. All Rights Reserved.