Image Details
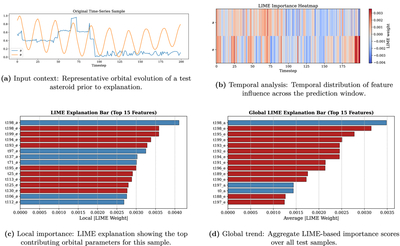
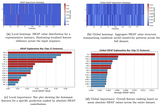
Caption: Figure 5.
LIME explanation results for the best-performing GRU model. Panels (a)–(d) illustrate the original time-series, temporal feature influence, local feature contributions, and global feature trends, respectively.
Other Images in This Article
Copyright and Terms & Conditions
© 2026. The Author(s). Published by the American Astronomical Society.
Copyright ©
2026 Astronomy Image Explorer. All Rights Reserved.