Image Details
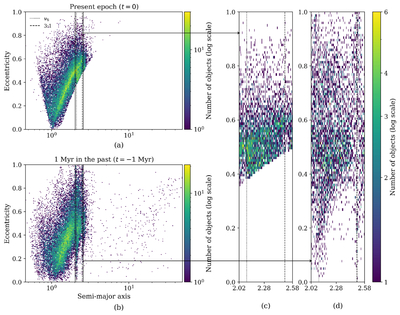
Caption: Figure 7.
Evolution of the orbital-element distribution for the nonejected NEA sample. Panel (a) shows the present epoch (t = 0) semimajor axis–eccentricity (a–e) density distribution, and panel (b) shows the backward-integrated epoch (t = −1 Myr) for the same sample. Colors indicate logarithmic number density. Vertical dashed lines (annotated in the panels) mark the nominal locations of the ν6 secular resonance and the 3:1 mean-motion resonance with Jupiter. Panels (c) and (d) show zoomed-in views of the corresponding regions highlighted in panels (a) and (b), respectively.
Other Images in This Article
Copyright and Terms & Conditions
© 2026. The Author(s). Published by the American Astronomical Society.
Copyright ©
2026 Astronomy Image Explorer. All Rights Reserved.