Image Details
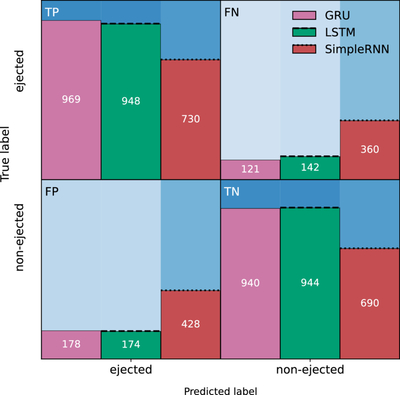
Caption: Figure 4.
Confusion-matrix-structured comparison of classification outcomes for the GRU, LSTM, and SimpleRNN models. Each quadrant corresponds to a confusion-matrix cell (true positive, false negative, false positive, true negative), with color-coded bars showing the results for each model; bar heights are normalized within each true-class row, while the numbers denote absolute counts.
Other Images in This Article
Copyright and Terms & Conditions
© 2026. The Author(s). Published by the American Astronomical Society.
Copyright ©
2026 Astronomy Image Explorer. All Rights Reserved.