Image Details
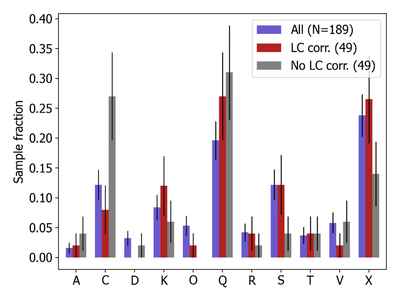
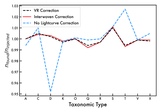
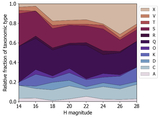
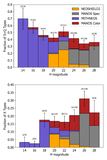
Caption: Figure 7.
Taxonomic type distributions for the full color sample (blue), the 49 objects with measured lightcurves that were used for rotational corrections (red), and those same 49 objects without proper lightcurve (LC) correction (gray). The full sample and the LC corrected sample are highly consistent within the ﹩\sqrt{N}﹩ Poison errors on each bin. The non-LC corrected sample shows significant differences; most prominent is a marked overabundance of C types.
Other Images in This Article
Show More
Copyright and Terms & Conditions
© 2026. The Author(s). Published by the American Astronomical Society.
Copyright ©
2026 Astronomy Image Explorer. All Rights Reserved.