Image Details
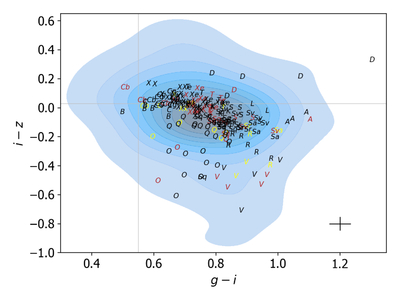
Caption: Figure 4.
Color–color plot of g − i vs. i − z colors of object in the MANOS sample. The assigned taxonomic classification for each object is indicated by the corresponding letters. The text is color coded by facility with the Kitt Peak Mayall in yellow, SOAR in red, and LDT in black. The background contours are a kernel density estimate (KDE) of 233 NEOs from the third release of the SDSS Moving Object Catalog (MOC, Z. Ivezic et al. 2002). The overlap of our colors with that of the MOC serves as a consistency check to our methodology. Mean error bars are indicated in the lower right. The solar colors are shown as the thin gray lines.
Other Images in This Article
Show More
Copyright and Terms & Conditions
© 2026. The Author(s). Published by the American Astronomical Society.