Image Details
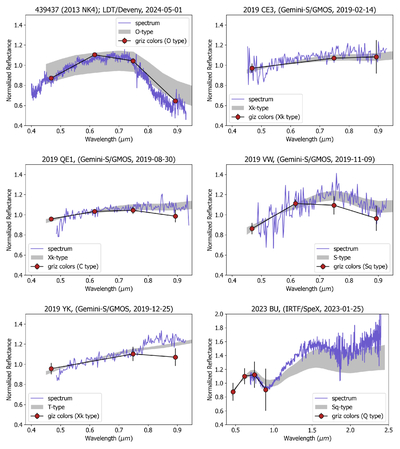
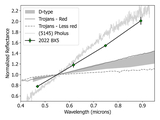
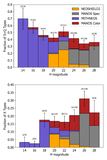
Caption: Figure 3.
Spectral results with color photometry overplotted. The spectrograph and date of observation are in the title of each panel. The color data and their best-fit taxonomic classification are in the legend. For the spectral data, the best-fit taxonomic types and associated 1σ envelopes are indicated by the gray filled regions in the background. In all cases, the colors are consistent to within ∼10% in reflectance relative to the spectra.
Other Images in This Article
Show More
Copyright and Terms & Conditions
© 2026. The Author(s). Published by the American Astronomical Society.
Copyright ©
2026 Astronomy Image Explorer. All Rights Reserved.