Image Details
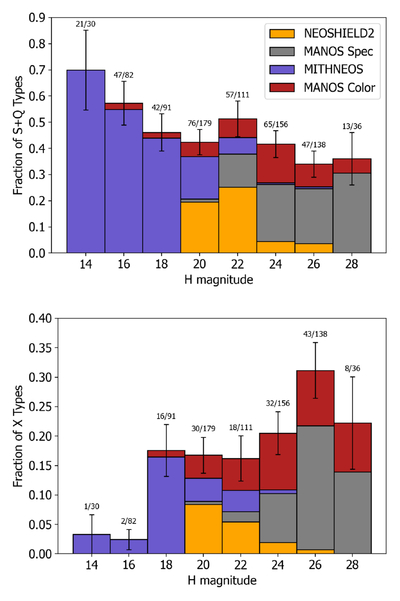
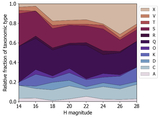
Caption: Figure 10.
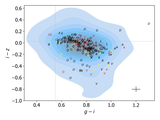
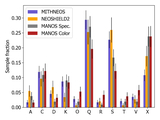
The fraction of S+Q complex (upper panel) and X complex objects (lower panel) in a combined set of NEOSHIELD2, MANOS, and MITHNEOS data, shown as a function of absolute magnitude H in 2 mag wide bins. The relative number of objects contributed by each survey is indicated in each bar by the color coding defined in the upper panel. The annotated fractions above each bin represent the number of that spectral complex in the numerator vs. the total number of objects for that H bin in the denominator. The error bars represent 1σ Poisson errors. Both panels show a trend in the distribution of these taxonomic types as a function of H.
Other Images in This Article
Show More
Copyright and Terms & Conditions
© 2026. The Author(s). Published by the American Astronomical Society.