Image Details
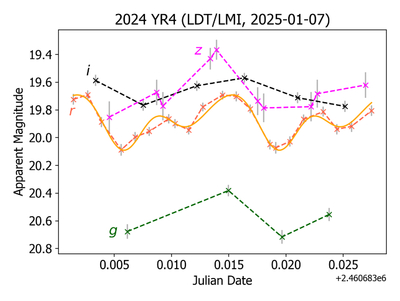
Caption: Figure 2.
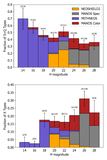
Time-series griz photometry for 2024 YR4 obtained from the LDT on 2025 January 7. Sets of exposures in the individual filters are color coded and annotated. The r-band data were obtained to track lightcurve variations over the 30 minutes color sequence. Fitting just those data with a third-order Fourier series (orange line) produced a reasonable period solution (P ∼ 0.33 hr) and amplitude (0.4 mag) consistent with other studies of this object (B. T. Bolin et al. 2025). This fitted lightcurve was used to compute the r magnitude at specific times throughout the imaging sequence so that g − r, r − i, and r − z colors could be retrieved.
Other Images in This Article
Show More
Copyright and Terms & Conditions
© 2026. The Author(s). Published by the American Astronomical Society.