Image Details
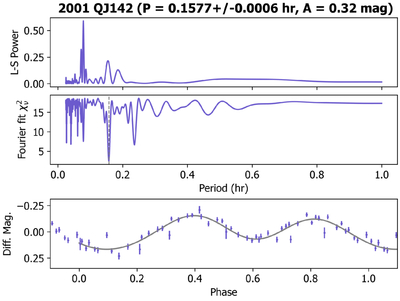
Caption: Figure A1. Lightcurve plots
The complete figure set (49 images) is available in the online journal.
The upper panel is a Lomb–Scargle (LS) periodogram, the middle panel is the χ2 statistic associated with Fourier series fits to the data as a function of rotation period, and the lower panel shows the photometric data points phase folded to the best-fit period, which is indicated in the title of each subplot and by the vertical gray dashed line in the middle panel.
Other Images in This Article
Show More
Copyright and Terms & Conditions
© 2026. The Author(s). Published by the American Astronomical Society.
Copyright ©
2026 Astronomy Image Explorer. All Rights Reserved.