Image Details
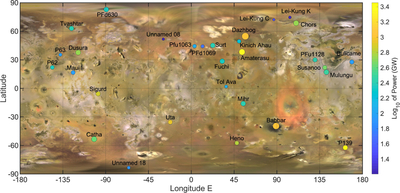
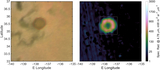
Caption: Figure 4.
Map of the hotspots investigated in this work. The size of the circles is roughly proportional to the hotspot area; color is coded according to total power output.
Other Images in This Article
Copyright and Terms & Conditions
© 2026. The Author(s). Published by the American Astronomical Society.
Copyright ©
2026 Astronomy Image Explorer. All Rights Reserved.