Image Details
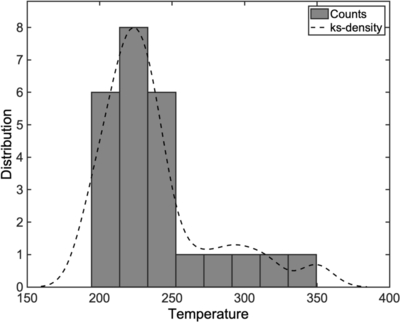
Caption: Figure 6.
Distribution of inferred crust temperature from Table 2. The dashed curve represents a kernel density estimation (ks-density) of the temperature distribution. A Gaussian kernel was used. This provides a smooth estimate of the underlying probability density of the temperatures.
Other Images in This Article
Copyright and Terms & Conditions
© 2026. The Author(s). Published by the American Astronomical Society.
Copyright ©
2026 Astronomy Image Explorer. All Rights Reserved.