Image Details
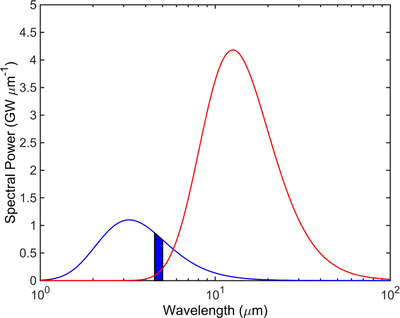
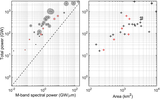
Caption: Figure 3.
In blue, the spectral power (spectral radiance integrated over solid angle and area) coming from the hotter ring of P63 (at 900 K); in red, the spectral power coming from the colder but much larger crust (at 230 K). The area for the crust is ∼500 km2 (as described in the main text); the area for the hotter ring is inferred from the measured M-band power, as in A. Mura et al. (2024a) and F. Tosi et al. (2025). The blue area represents the integrated signal captured in the M band of JIRAM (or any other instrument working in the 4.5–5 μm range). Adapted from F. Tosi et al. (2025) for the case of P63.
Other Images in This Article
Copyright and Terms & Conditions
© 2026. The Author(s). Published by the American Astronomical Society.
Copyright ©
2026 Astronomy Image Explorer. All Rights Reserved.