Image Details
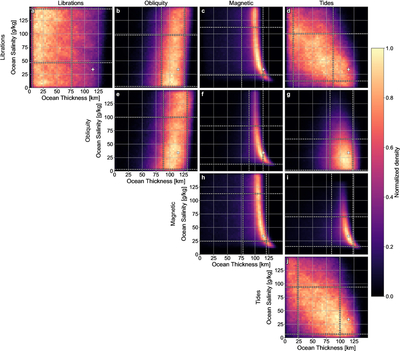
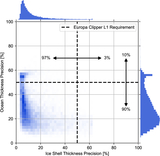
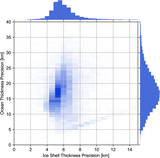
Caption: Figure 7.
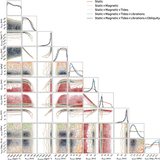
Histograms for ocean thickness and salinity derived from the inversion of multiple combinations of geophysical constraints. The organization of this figure is the same as Figure 6. The white dashed lines represent the 68% credible interval. The white plus sign represents the reference model used as ground truth.
Other Images in This Article
Show More
Copyright and Terms & Conditions
© 2026. The Author(s). Published by the American Astronomical Society.
Copyright ©
2026 Astronomy Image Explorer. All Rights Reserved.