Image Details
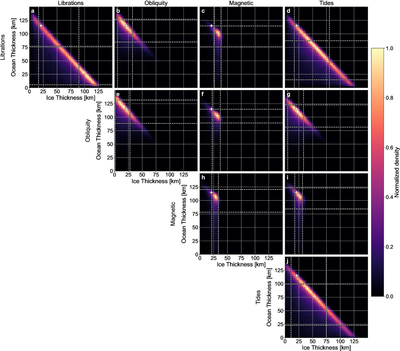
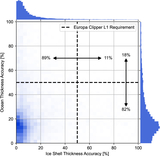
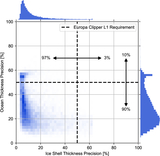
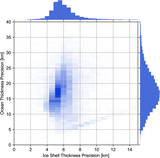
Caption: Figure 6.
Histograms for ice and ocean thicknesses derived from the inversion of multiple combinations of geophysical constraints. All the cases are based on static gravity constraints given by the total mass and MoI. Each case includes additional constraints, as indicated by the labels on the rows and columns. The panels on the diagonal are based on the joint inversion of static gravity and only one other observation dataset. The off-diagonal panels represent the combination of static gravity and two additional datasets. As a reference, the static gravity only results in the same figure as in panel (a). The cases are static gravity + (a) librations, (b) librations + obliquity, (c) librations + magnetic induction, (d) librations + gravitational tides, (e) obliquity, (f) obliquity + magnetic induction, (g) obliquity + gravitational tides, (h) magnetic induction, (i) magnetic induction + gravitational tides, and (j) gravitational tides. The white dashed lines represent the 68% credible interval. The white plus signs represents the reference model used as ground truth.
Other Images in This Article
Show More
Copyright and Terms & Conditions
© 2026. The Author(s). Published by the American Astronomical Society.