Image Details
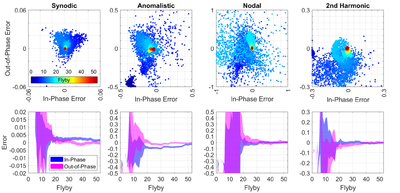
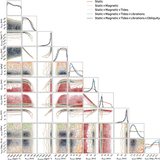
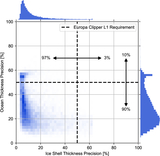
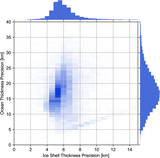
Caption: Figure 2.
Induction parameter errors from the Monte Carlo simulation. (Top row) Complex response parameter errors associated with the inversion of the induction field for the four dominant periods. Each dot represents the error from an individual Monte Carlo simulation, and its color reflects the flyby number for which it was evaluated. (Bottom row) These figures show the envelope of the in-phase and out-of-phase errors as a function of Europa Clipper flyby number.
Other Images in This Article
Show More
Copyright and Terms & Conditions
© 2026. The Author(s). Published by the American Astronomical Society.
Copyright ©
2026 Astronomy Image Explorer. All Rights Reserved.