Image Details
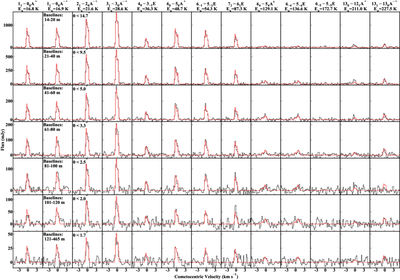
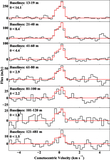
Caption: Figure 9.
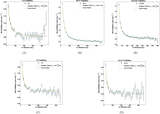
Observed spectra for all detected CH3OH transitions in K2, with the best-fit model overlaid in red. Each spectrum is averaged over a range of uv distances, provided in the upper left corner, corresponding to a range of angular scales in the coma.
Other Images in This Article
Show More
Copyright and Terms & Conditions
© 2026. The Author(s). Published by the American Astronomical Society.
Copyright ©
2026 Astronomy Image Explorer. All Rights Reserved.