Image Details
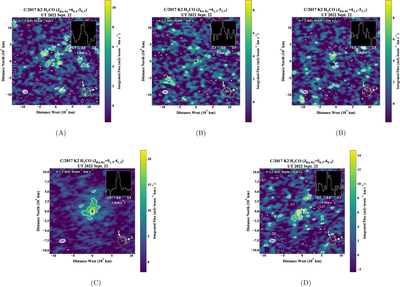
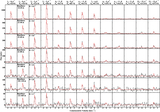
Caption: Figure 8.
(a–d) Spectrally integrated flux maps for all detected H2CO transitions in K2, with traces and labels as in Figure 1. Contours are in 5σ increments for H2CO (JKa,Kc = 51,5 − 41,4). Contours are 3σ and 5σ for H2CO (JKa,Kc = 50,5–40,4), (JKa,Kc = 40,4–30,3), (JKa,Kc = 42,2 − 32,1), and (JKa,Kc = 42,3–32,3).
Other Images in This Article
Show More
Copyright and Terms & Conditions
© 2026. The Author(s). Published by the American Astronomical Society.
Copyright ©
2026 Astronomy Image Explorer. All Rights Reserved.