Image Details
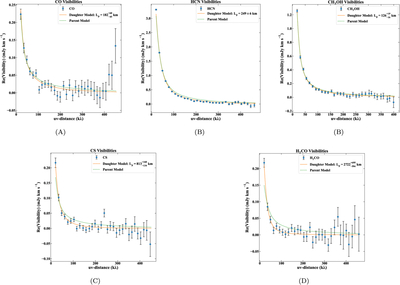
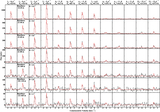
Caption: Figure 6.
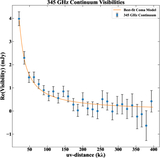
(a–d) Real part of the observed visibility amplitude as a function of projected baseline length for CO, HCN, CH3OH, CS, and H2CO. Best-fit daughter models, as well as a parent model, are overplotted for comparison. The uv distance has been plotted in units of kλ.
Other Images in This Article
Show More
Copyright and Terms & Conditions
© 2026. The Author(s). Published by the American Astronomical Society.
Copyright ©
2026 Astronomy Image Explorer. All Rights Reserved.