Image Details
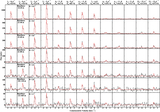
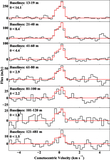
Caption: Figure 1.
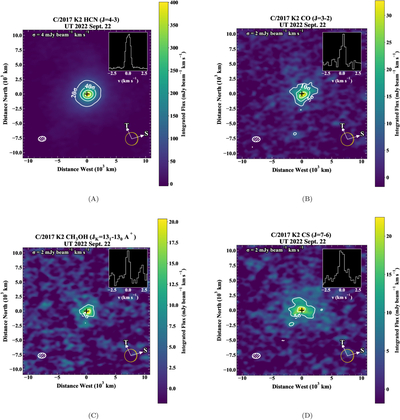
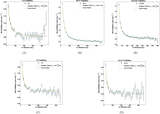
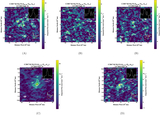
(a–d) Spectrally integrated flux maps for HCN, CO, CH3OH, and CS in K2. Contour intervals in each map are given in multiples of the rms noise. The rms noise (σ, mJy beam−1 km s−1) is indicated in the upper left corner of each panel. Sizes and orientations of the synthesized beam (Table 1) are indicated in the lower left corner of each panel. The comet’s observer-centered illumination (ϕ ∼ 25°) and the direction of the Sun (S) and dust trail (T) are indicated in the lower right corner. The black plus sign indicates the position of the peak continuum flux. A spectrum extracted from a 10″-diameter aperture centered on the nucleus (spanning projected radial nucleocentric distances of 8500 km) is shown in the upper right corner. Contours are in 20σ increments for HCN and 5σ increments for CO, CH3OH, and CS.
Other Images in This Article
Show More
Copyright and Terms & Conditions
© 2026. The Author(s). Published by the American Astronomical Society.