Image Details
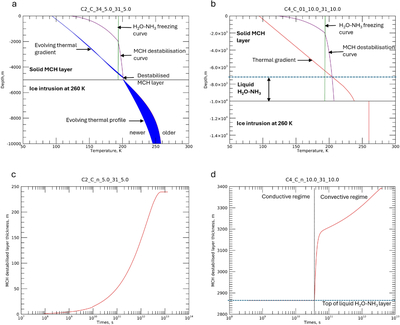
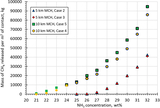
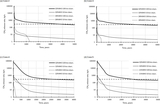
Caption: Figure 4.
Examples of model output (annotated). These images are generated at the end of each model run. Figure 4(a) shows an evolving 5 km thick MCH layer model run. The purple line is the MCH destabilization curve for an ammonia content of 31wt% in pockets of brine within the ice shell. The green line is the freezing temperature for ammonia hydrate with the same ammonia content. The family of evolving thermal profiles through the MCH layer and the warm ice below is shown in blue. At this stage of the process, the destabilized MCH layer is 220 m deep. Figure 4(b) shows the starting point for a 10 km thick MCH layer, which is above a thick layer of liquid water–ammonia. Figure 4(c) shows the complete destabilization profile for Case 2 (5 km of MCH) run (239 m of MCH destabilized). Figure 4(d) shows the full profile for a 10 km thick MCH model run. Here, the initial heating of the liquid (a layer 2864 m deep) is treated as conductive before convection increases the temperature at the liquid/solid MCH interface, triggering melting of the MCH. The titles of the plots (e.g., C2_C_34_5.0_31_5.0) include the input parameters. C2 = Thermal gradient Case 2. 34 is the 34th model cycle. The two values of 5.0 refer respectively to the depth, in kilometers, of the MCH layer and the depth of contact with the warm ice. 31 refers to the MCH ammonia content in wt% in pockets of brine. Each cycle consists of 100,000 iterations. Initially, each iteration represents 9.2 × 10⁴ s, with new thermal profiles (blue) output every 1000 iterations. With 20,000 elements in the MCH layer, the model mesh Δx is 0.25 m in the MCH and 0.70567 m in the ice. Model details and equations are given in Section 6 and Appendix A.
Other Images in This Article
Copyright and Terms & Conditions
© 2026. The Author(s). Published by the American Astronomical Society.