Image Details
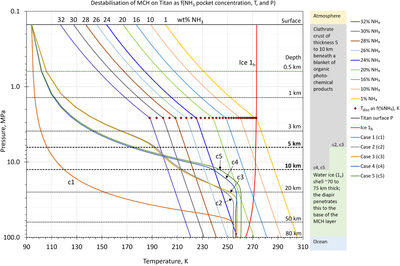
Caption: Figure 2.
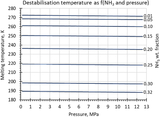
Stability of MCH in Titan’s crust. Temperature profiles (curves c1 to c5) in the MCH layer and ice crust beneath (after K. Kalousová & C. Sotin 2020) are compared with the destabilization temperature of MCH in the presence of aqueous ammonia (from 1 to 32wt%). Curves c1 to c5 represent different thicknesses of MCH, stagnant lid thickness, and amount of tidal heating (Table 1). The MCH layer is 5 km thick in Cases 2 and 3, and 10 km thick for Cases 4 and 5. Case 1 is a reference, showing the thermal gradient for a pure ice crust with no tidal heating. Also shown is the melting profile for hexagonal ice (Ih). A selection of MCH destabilization curves is shown for different ammonia values that are local concentrations in pockets of melts, as described in the text. The presence of ammonia does not significantly change the initial thermal gradient profiles within the MCH and icy shell from those of K. Kalousová & C. Sotin (2020). The release of methane requires the temperature to be above the destabilization curve. The higher the ammonia wt%, the lower the MCH destabilization temperature. The line of diamond symbols shows the MCH triple point at 2.6 MPa as a function of the ammonia wt% (after E. D. Sloan & C. Koh 2007). Triple point values from 1wt% to 32wt% are shown.
(The data used to create this figure are available in the online article.)
(The data used to create this figure are available.)
Other Images in This Article
Copyright and Terms & Conditions
© 2026. The Author(s). Published by the American Astronomical Society.